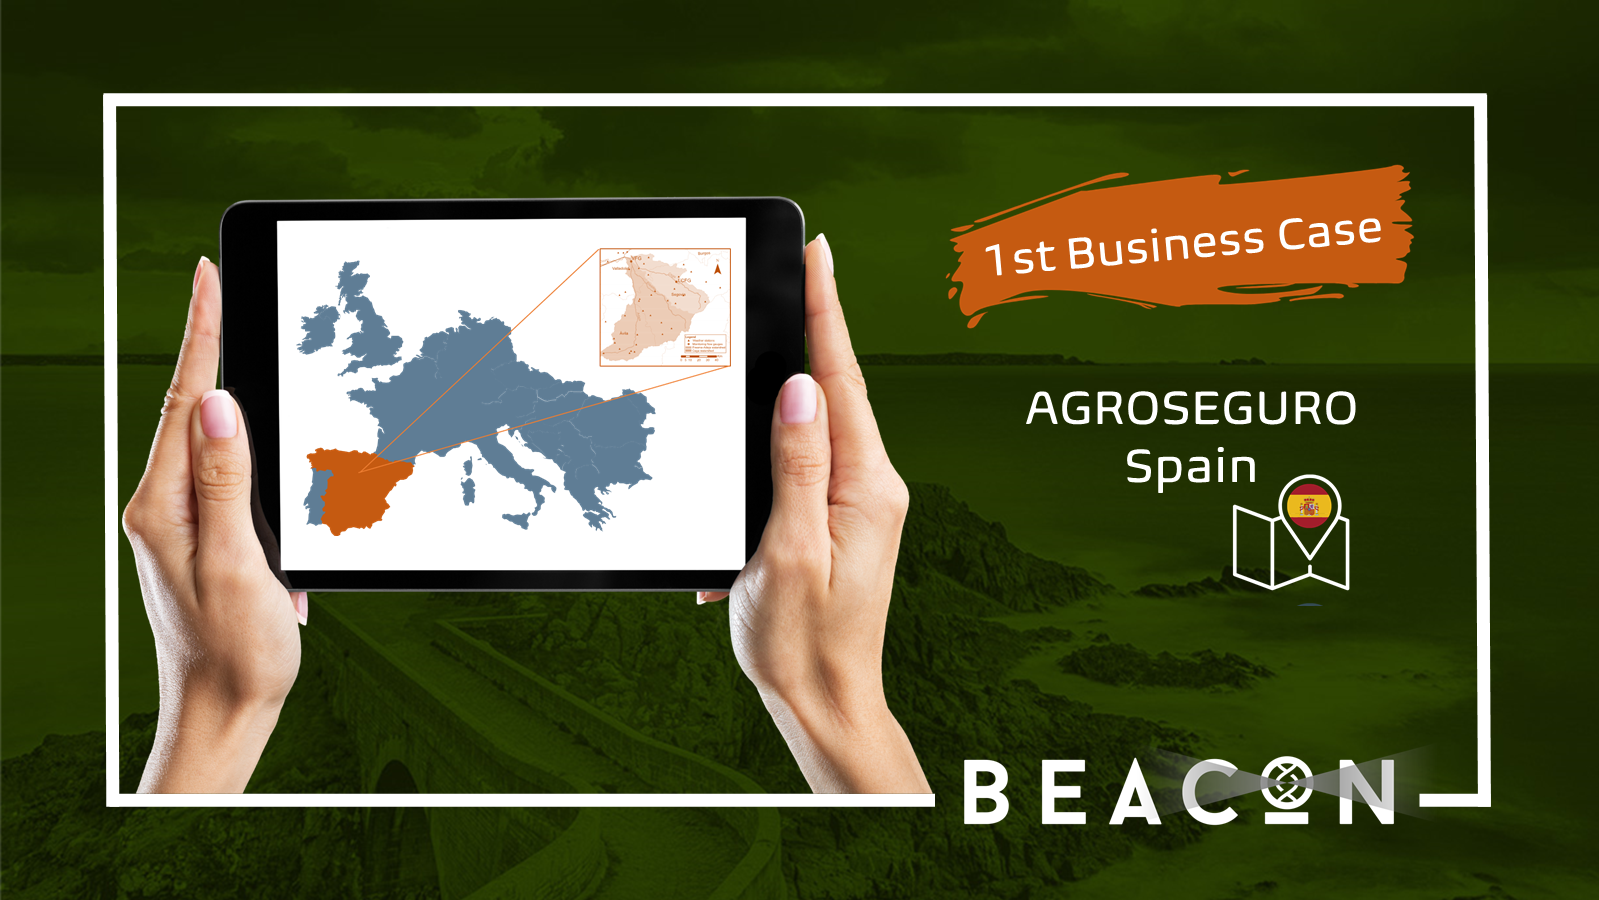
3rd BEACON Business Case
The 3rd BEACON Business Case represents theGreek Case conducted together with KARAVIAS Underwriting Agency from Athens, Greece. The Case is focused on the insurance against flood.
![]()
Cotton crops flash-flood damage – validation of the BEACON Damage Assessment Calculator component’s accuracy
KARAVIAS Underwriting Agency, Greece
KARAVIAS Underwriting Agency is founded in 2014. As Coverholder at Lloyd’s, the company has the capacity and experience to provide insurance solutions in the agricultural sector. Crop producers and agribusiness entities around the world are realizing the value of forward - thinking insurance providers who can provide innovative products, financial strength, and superior risk management. KARAVIAS Underwriting Agency is able to provide risk assessment, risk underwriting, policy issuance and claims management. The Agency is already active in all Insurance sectors and is very well recognized among a sales network of almost 2.000 brokers and insurance consultants, seeking to expand its activity through innovative services and pioneering solutions based on new technologies and experienced executives.
For flood damage assessment, BEACON employs optical and C-Band SAR satellite data for delineating and mapping a flooded area, for determining the beginning and the duration of the flood, as well as for damage assessment. Natural hazards included in this case are:
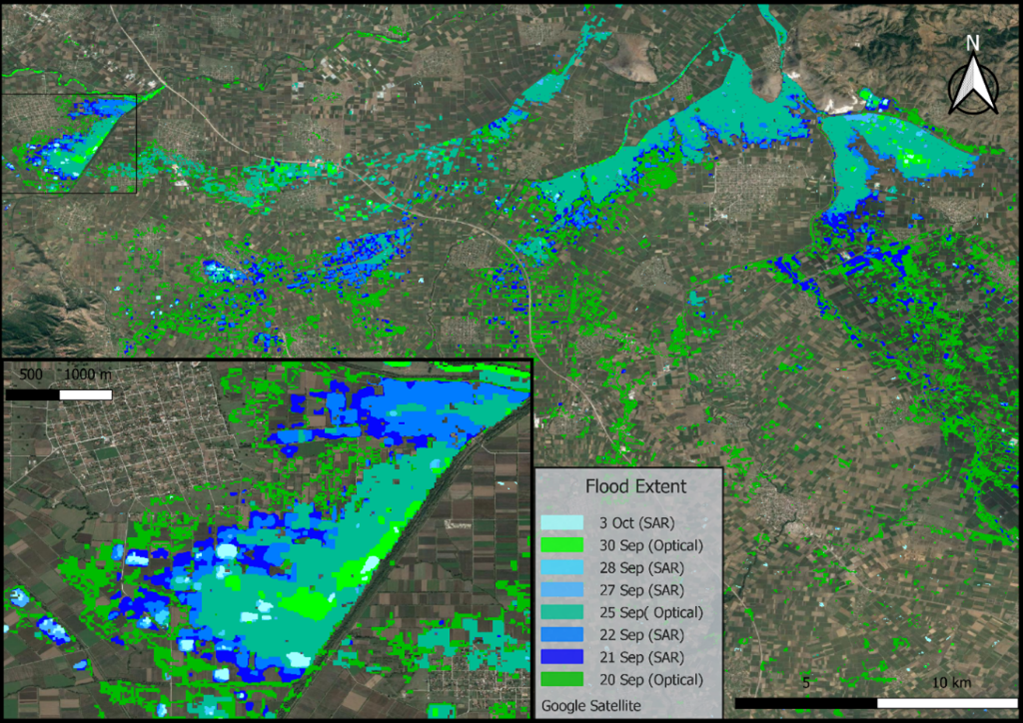
Optical satellite data were acquired and processed for flood mapping and detection. The first available Sentinel-2 image after the event was captured on the 20th of September with a 25% cloud coverage, partly located over the flooded area. Next optical images were acquired on September 25th and 30th.
Radar satellite data were also acquired and processed for flood detection, delineation and duration estimation.
Machine Learning approach
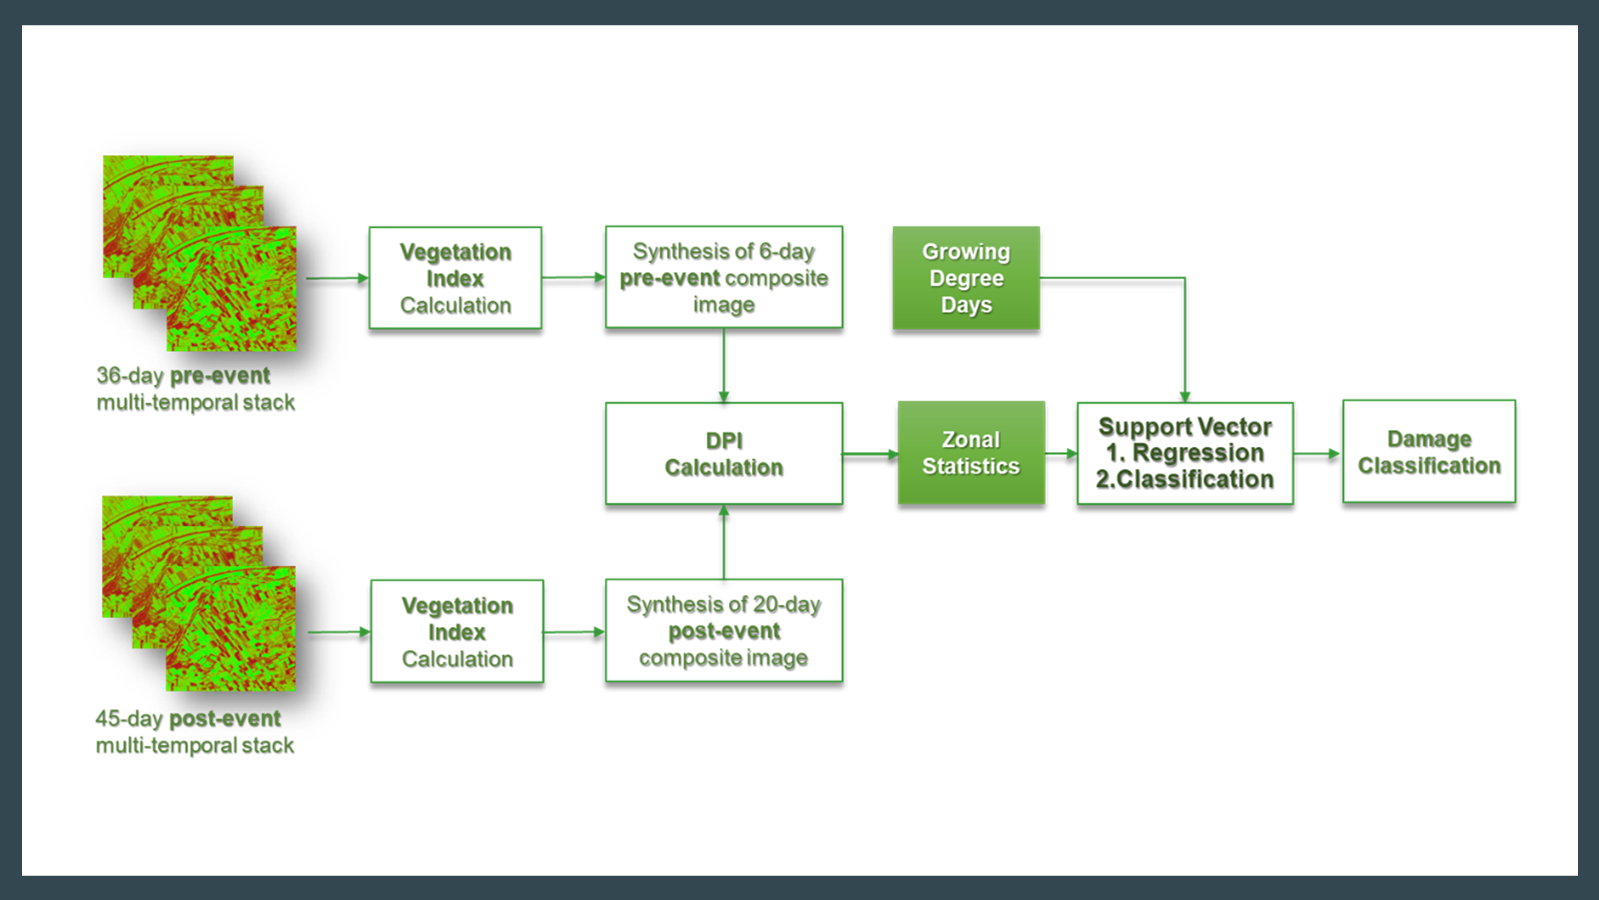
 The methodology for floods that is developed and incorporated in BEACON was tested and evaluated against Copernicus Emergency Management Service (CEMS) in terms of optical and radar EO products. The high overall accuracy reached 94% (Kappa 0.584) revealed very good agreement for the flood delineation automated process considering that CEMS product is created based on a semi-automated approach that also involves visual interpretation in order to draw the flood extent border.
The flooded area in the municipality of Karditsa was detected and delineated following the workflow implemented in BEACON. A number of 13 registered cotton parcels in the BEACON platform during pilot implementation were flooded and damaged. A great 90% of the total pilot parcels area was unaffected by the flood, while the duration of flooding was estimated up to 6 days.
Flood Duration and extend between the 20th of September and 3rd of October
WHAT YOU CAN READ NEXT